Iran Mercantile Exchange physical trades
50,421 recorded trades from 3/28/21 to 11/4/26. Each commodity has its own page with its settlement prices, supply and demand, and mills.
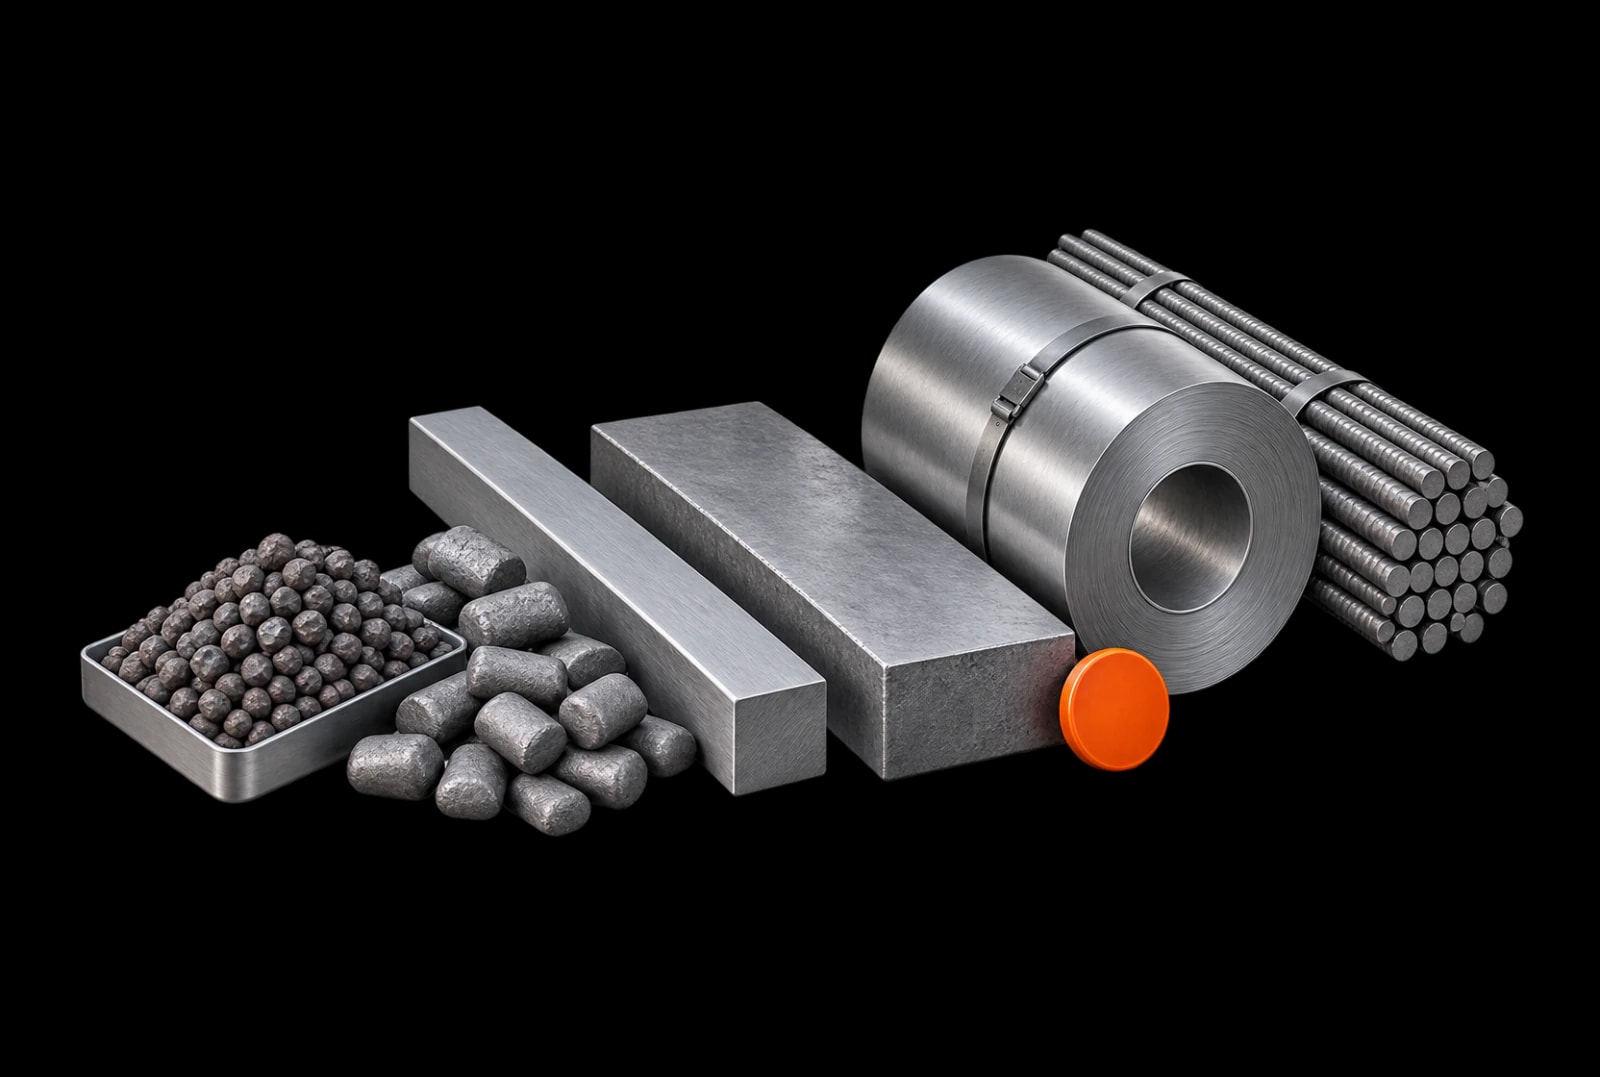
Commodity groups
The latest official session for each group, with that session’s most-traded good.
| Commodity groups | Session | Goods | Settlement | Demand to supply |
|---|---|---|---|---|
| Steel | 11/4/26 | Rebar 14–20-A3 | 106,801 | 1.43 |
| Iron ore | 11/3/26 | Iron-ore concentrate | 14,106 | 1.00 |
| Direct-reduced iron | 11/1/26 | Direct-reduced iron | 63,816 | 1.84 |
| Cast iron | 11/1/26 | Steel billet | 81,607 | 1.60 |
| Coke | 10/25/26 | Metallurgical coke 80-25 | 47,370 | 1.00 |
| Ferrosilicon | — | — | — | — |
| Concentrate | 10/28/26 | Iron-ore concentrate | 74,015,250 | 6.42 |
| Aluminium | 11/4/26 | Steel billet 6063-7 | 858,483 | 0.17 |
| Copper | 11/4/26 | Copper | 3,319,674 | 0.10 |
| Zinc | 11/1/26 | Steel billet 99.98 | 739,784 | 2.11 |
Benchmark goods
The most-traded good in each family over the trailing year, priced at the last session that good actually traded in.
How to read this page
The exchange publishes Rial per kilogram; only the currency is converted here, to Toman per kilogram. VAT, fees and freight are not added.
These are session trades, not a live tick. Each good trades in its own session, so “previous session” means that good’s own previous session, not yesterday.
Every average is weighted by tonnage: a 5,000-tonne lot and a 25-tonne lot do not move the figure equally.
The seasonal pattern and the demand-to-supply ratio describe past behaviour. Neither is a price forecast.
Official data source: Iran Mercantile Exchange
Latest session available: 11/4/26
Archive from 3/28/21